May 29, 2023
Happy Memorial Day!
About fifty years ago, some brainless guy wrote a book entitled "A Random Walk Down Wall Street."
The guy who wrote the book made a lot of money and became well known so in that respect he was not brainless.
The reason we say the author was brainless is because the author is very wrong. He theorized that it is impossible to predict the stock markets. Thus the name "Random Walk." To the author, there was no rhyme or reason to the movement of stock prices and he claimed the stock market was impossible to predict.
That is because the author was not intelligent enough to figure it out.
The fact of it is that an AstroFibonacci analyst can make pretty darn good predictions about stock prices; good enough to bury the Random Walk Theory.
AstroFibonacci is a discovery of the Magi Society and it is an important part of Financial Magi Astrology.
The gift of AstroFibonacci Information will help all stock traders make better trades and investments.
AstroFibonacci also helps to prove that planetary motion does indeed directly influence stock and commodity prices.
In order to understand AstroFibonacci, you may wish to first read about it on our website at:
After you go onto the site, we suggest you scroll down the home page and read the center articles about Fibonacci, AstroFibonacci, and Planetary Periods.
Professional traders have been using Fibonacci for decades - all the way back to the days of legendary W.D. Gann. In fact virtually all of the automated trading programs have Fibonacci built into their software, and both guests and hosts on CNBC, the main financial news channel, occasionally mention Fibonacci levels in their analyses.
Professional traders use Fibonacci ratios to help them predict when stock and commodity prices are MOST LIKELY TO CHANGE DIRECTION, both for the long term and for the short term.
Fibonacci is very helpful to the trained stock trader.
But AstroFibonacci is even more useful.
There are only four Fibonacci levels - which means there are only four support/resistance levels derived from the use of Fibonacci ratios. All four are probable major turning points, or breakout points. But four is simply not enough levels to work with.
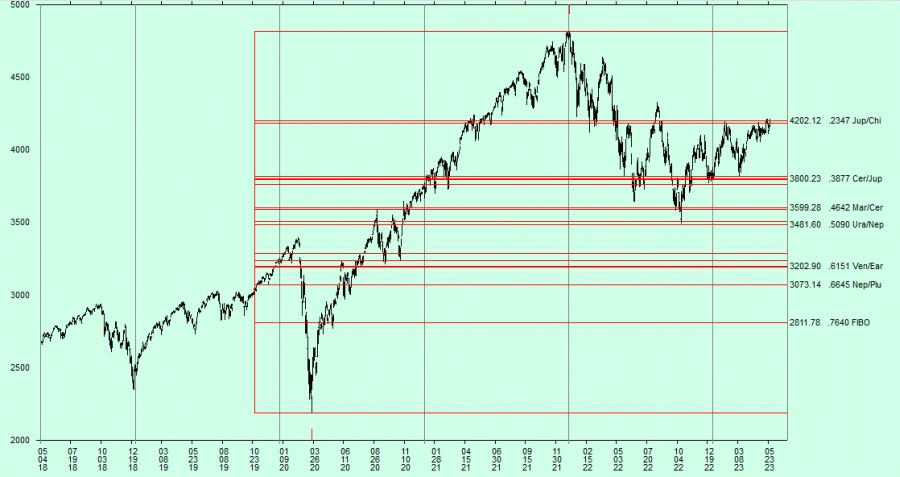
There are seven major AstroFibonacci ratios, which means you know about three additional major probable turning points (or breakout points). This is almost twice as many and that is how many are used in the stock chart below, which is a chart of the S&P 500 Index from June 2018 until today:

The thing to note about the chart is that the AstroFibonacci ratio levels are displayed on the left margin of the chart and are represented by the red horizontal lines, and you can see that the major turns in the stock prices are very often made very precisely at the AstroFibonacci levels.
The rule of AstroFibonacci is:
Stock prices (and the price of any financial instrument such as commodities, currencies, etc.) are most likely to turn at AstroFibonacci levels.
Stock prices will usually gravitate towards an AstroFibonacci Level and normally will move from one AstroFibonacci Level to another AstroFibonacci Level.
If this is true, and the above chart demonstrates that it is, then an expert AstroFibonacci analyst could predict stock prices with a level of accuracy that is much better than any random walk.
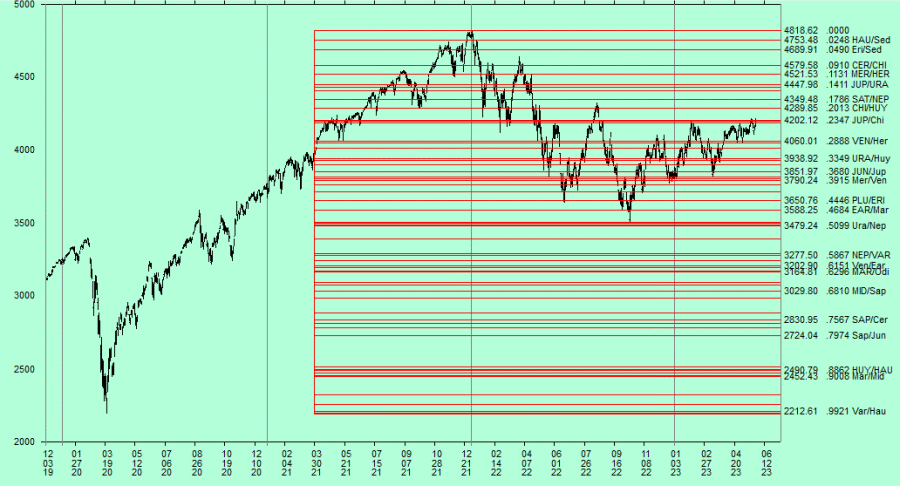
The Magi Society's AstroFibonacci experts use a total of 56 AstroFibonacci Ratios, by adding additional planet ratios such as Chiron/Uranus and Midas/Juno. The stock chart below shows the additional AstroFibo levels:

Every day in every financial market, you can actually see AstroFibonacci ratios working and they work better than simple Fibonacci.
All charts in this article were created by the Magi Society's AstroFibonacci software program. If you have an interest in reading more about AstroFibonacci and how to get the program, please click here.